


Ever wondered how to build a chart using react?
For a long time, I had been scared of building charts with react because I imagined it would take complex code to build and implement charts. Turns out I was wrong😅, building a chart with react is way easier because there are many libraries that offer instant implementation out of the box. eg. Nivo.rocks, Recharts, Visx, Victory charts etc.
Why Did I choose chart.js?
I finally decided to use chart.js because I tried for days to implement Nivo.rocks, Recharts and Victory but it didn't quite work well for me, although they are great charting libraries. The major issue was that the chart did not render on the browser and I couldn't get a work-around solution for it.
Let's dive into the code part, I know you've been waiting😛
N.B You be at least familiar with react to follow through this tutorial
First, open your IDE (I use VS Code) and open the terminal (Shortcut: Cltr + Shift + `).
//Run the code in the terminal
npx create-react-app <Name of your app. eg. charts/>
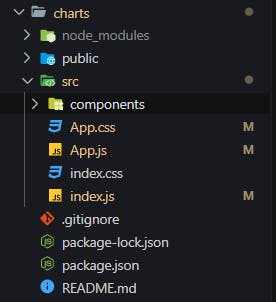
After React has finished installing, we modify our folder and delete boilerplate files so that it becomes something like this:
 Go back to the terminal in VS Code and run the following code:
/*To install the chart library*/
npm i react-chartjs-2 chart.js

/*To start react on development server*/
npm run start
Let's build a simple Line Chart
Create a new file in the components folder named LineChart.js and import Line component from react-charts-2
import React from "react";
import { Line } from "rechart-chartjs-2";

const LineChart = () => {
  return (
    <>
      <Line />
    </>
  );
};

export default LineChart;
A Data prop can be passed into the Line component. It is the life of the component and the structure takes the form
const chartData =  {
    labels: ['Monday', 'Tuesday', 'Wednesday',
             'Thursday', 'Friday'],
    datasets: [
      {
        label: 'Sunlight',
        fill: true,
        lineTension: 0.9,
        backgroundColor: 'rgba(75,192,192,1)',
        borderColor: 'rgba(0,0,0,1)',
        borderWidth: 2,
        data: [34, 03, 94, 109, 192]
      }
    ]
  }
We would then pass chartData as a prop to the Line component
import React from "react";
import { Line } from "rechart-chartjs-2";

const LineChart = () => {
  return (
    <>
      <Line data={chartData} />
    </>
  );
};

export default LineChart;
Let's also add some other props to see how it affects the chart outlook
import React from "react";
import { Line } from "react-chartjs-2";

const LineChart = () => {
  const chartData = {
    labels: ["Monday", "Tuesday", "Wednesday", "Thursday", "Friday"],
    datasets: [
      {
        label: "Sunlight",
        fill: true,
        lineTension: 0.1,
        backgroundColor: "rgba(75,192,192,1)",
        borderColor: "rgba(0,0,0,1)",
        borderWidth: 2,
        data: [34, 3, 94, 109, 192],
      },
    ],
  };

  return (
    <>
      <Line
        data={chartData}
        height={100}
        width={400}
        options={{
          maintainAspectRatio: false,
          responsive: true,
        }}
      />
    </>
  );
};

export default LineChart;
Now, let's see the result on the webpage🤩
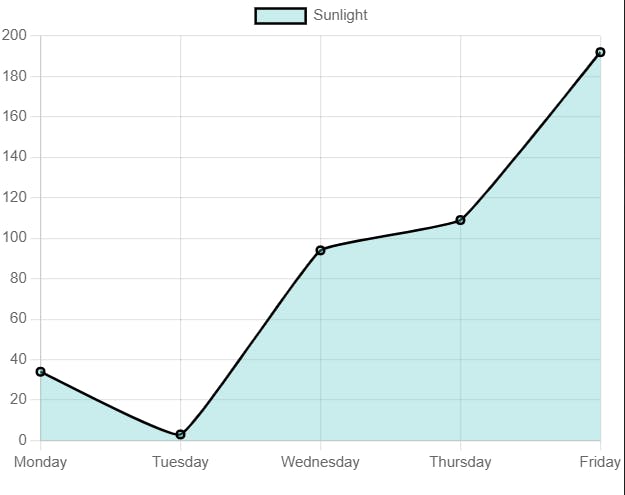
You have now created your first chart using chart.js 🎉🎉
There are many other props that can be passed into the component eg. Options (let's us modify to a great extent, the outlook of our chart), Height, Width etc.
I hope I have been able to walk you through on how to set your chart running with Chart.js react wrapper library
To read more on Chart.js, Visit the official documentation page Here